
Winston Saunders has worked at Intel for nearly two decades and currently leads server and data center efficiency initiatives. Winston is a graduate of UC Berkeley and the University of Washington. You can find him online at “Winston on Energy” on Twitter
 WINSTON SAUNDERS
Intel
With the recent publication of the Green500 and Top500, it’s time to update the Exascalar analysis. You may recall that Exascalar is a way to look simultaneously at efficiency and performance trends of the world’s leading supercomputers..
I chose the theme of this blog based on the Top10 Exascalar systems for June 2013, listed below. There are two new entries, both at the top of the list. The highest ranking Exascalar system is also the performance leader of the Top500, the heterogeneous Chinese Tianhe-2 computer based on Intel Xeon and Xeon Phi which weighs in not only with very high efficiency but on a scale of 17.8 MW. High efficiency systems now are so dominant in high performance supercomputers there is only a slight re-ordering of the top performance systems by Exascalar. Note that the median efficiency scalar equals the best on the list whereas the median performance scalar differs from the best by about 20 percent. This is what is meant by the performance push to high efficiency: while high efficiency may not always translate to high performance, highest performance requires high efficiency.

Figure 1. Click to enlarge chart.
The Performance Efficiency scalar analysis as shown in Figure 2 below shows all the characteristics of the Exascalar Taxonomy I discussed previously: the now-familiar triangular shape, the (somewhat stretching) power wall, and in the lower right the innovation doorway, where emergent high efficiency systems first come onto the scene (in this case the Green500 leader, CINECA’s Eurora system based on Xeon and NVidia GPUs).

Figure 2. Click to enlarge graphic.
Those familiar with Exascalar will notice a slight change in the graph. The concentric circles of previous Exascalar analyses are replaced by straight lines. This change results in only very small changes to the Exascalar values (for the leading system less than 0.1 percent), simplifies calculation, improves long term “Exascalability.” I’ll write more about the changes to Exascalar in a subsequent blog.
The blue Top10 Exascalar line is now inside ∈ = -3 for the first time. The green trend line, showing the evolution of the Top Exascalar system since November 2007, reveals the close parametric relationship between supercomputing leadership and Exascalar. While the leading system for June 2013 took a small backward step in efficiency, the overall gain in performance (at the expense of increased power) improved Exascalar.
The fit parameters of the historical Exascalar Trend continue to show an increase of about 0.35 per year (or a factor of about 2.3), consistent with the June 2012 trend. The Top Exascalar fitted line intercepts zero near April 2019. However, without breakthroughs to increase the rate of efficiency increase above historical levels, the trend will become increasingly difficult to maintain due to power costs.
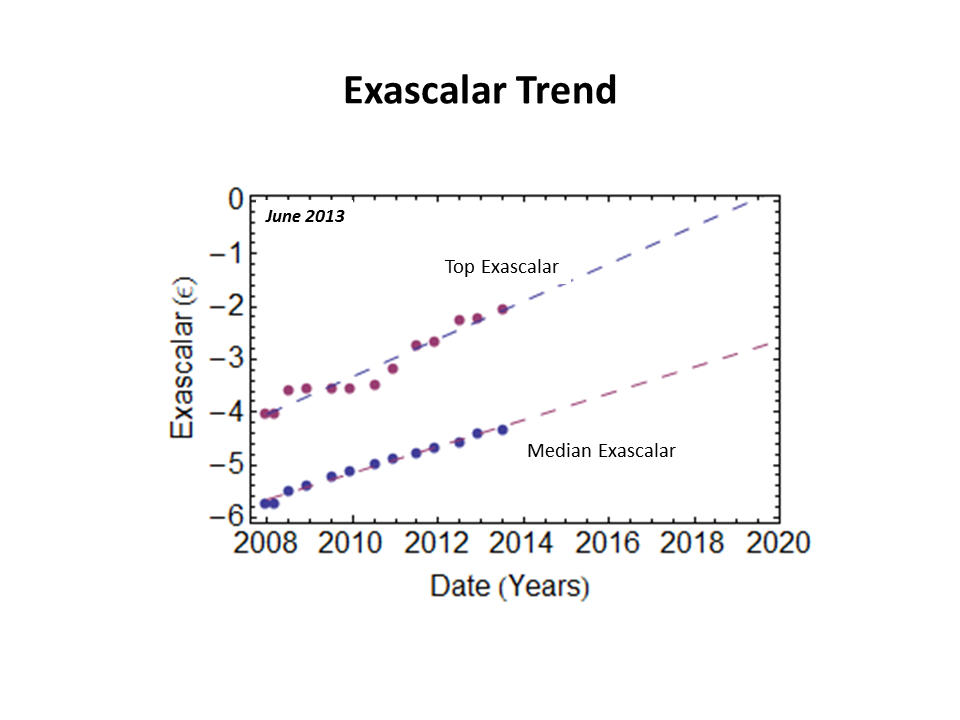
Figure 3. Click to enlarge graphic.
Which brings us back to our theme, the performance push to high efficiency. Overall, Exascalar continues to reflect the amazing progress being made in supercomputing. The fact that Exascalar reflects mostly performance differentiation of systems proves the indispensability high efficiency in high performance. However, as we can see from the trends, even greater pushed in efficiency are required; without more breakthroughs, the current Exascalar march appears to be at risk as power limitations start imposing themselves
As I mentioned above, I’ll review some of the thinking behind the (minor) changes in the way Exascalar was calculated in my next blog. Until then, let me know your comments, questions, or concerns below.
Industry Perspectives is a content channel at Data Center Knowledge highlighting thought leadership in the data center arena. See our guidelines and submission process for information on participating. View previously published Industry Perspectives in our Knowledge Library.


