
As the data center continues to become an integral part of any organization, uptime becomes a greater concern for many administrators. Mitigating risk and reducing downtime is a very important activity which must be monitored, reported upon and documented. The challenge becomes the separation of duties within the data center environment. Where do IT administrators focus to maintain the highest level of uptime? Keeping hardware services running is important. Furthermore, focusing on the workloads running on those servers is crucial as well. This doesn’t mean just the virtual machine and service redundancy. There are direct financial benefits to using power system analytics to help mission-critical applications running longer and smoother.
Consider this, in two published studies by Ponemon Institute (2010 and 2011) the key findings show that application-level downtime can be extremely costly. The results show how human error during maintenance or regular operations can negatively affect both business flow and uptime.
• Average cost of data center downtime: $5,600 per minute.
• Average reported incident length: 90 minutes
• Average cost of a single downtime event: $505,500.
• Contribution of human error to downtime: 25-50%
Power system analytics technologies can help administrators run simulations around their environment to help improve planning sessions, ROI and gain a greater understanding of the underlying data center infrastructure. Running analytics tools can really be beneficial to understand system configurations for maintenance cycles and help redistribute load as required. The power of these tools comes from the data they produce. User-friendly and easy to understand metrics allow technicians to understand where equipment, feeders, buses, and critical electrical/mechanical loads are standing.
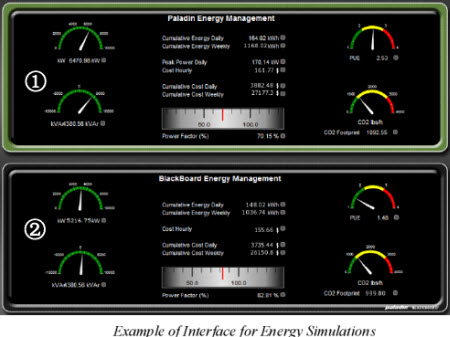
1. Top panel displays actual energy usage and related metrics power factor, PUE, carbon footprint) from the data historian, with utility rates and penalties schedule applied.
2. Bottom panel displays identical information, but using model-validated analytics based on the current simulation.
Download this whitepaper to see how using Power System Analytics data center owners and operators to gain greater insight into the current and future state of their facilities. Furthermore, this paper helps administrators take preemptive steps to optimize capacity expansion plans, energy usage, and maintenance activities. The idea is to reduce downtime and improve mission-critical application efficiency. Technicians will be more aware of their environment and reduce downtime due to human error. Using model-validated electrical simulation and analytics tools can help organizations realize more ROI and – very importantly – maintain higher levels up uptime. Click here to get this paper.


