
Rajat Ghosh is a Postdoctoral Fellow at the CEETHERM Data Center Laboratory, G.W. Woodruff School of Mechanical Engineering, Georgia Institute of Technology.
His website is RajatGhosh.wordpress.com and he is available on LinkedIn.
Making a data center operation "lean" is increasingly becoming a critical business and regulatory requirement. A lean data center operation can satisfy its customers in the most cost-effective manner.
One potential solution for data center operational expenditure (OPEX) optimization lies in adopting the usage-based pricing model for resource consumption. To realize that goal, a data center’s resource supply and demand sides should match as closely as possible. Following the time-tested management adage, “You can’t manage what you can’t measure,” this article proposes a metric, namely resource allocation index (RAI), to measure the matching between demand and supply sides of data center resources.
Data Center Value Chain

Figure 1: Resource Utilization Landscape for an Internet Data Center (IDC) Value Chain (Click to enlarge graphic.)
Figure 1 shows the resource utilization landscape for an internet data center (IDC) value chain, which acts as an engine room for the prevalent client-server based commodity computing.
The demand side of an IDC is driven by its users. It can be defined as the number of login requests received. Depending on the nature of the IDC, the login requests could be transactional (e.g. Bank of America website), computational (analysis websites such as WolframAlpha Mathematica), archival (e.g. Facebook), merchandise (e.g. Amazon), and content query (e.g. Google). This incoming network traffic poses demands in the form of electronic operations in IT equipment (ITE)—such as volume servers, network switches, and storage disks. Depending on the type of an application, an IDC might utilize different combinations of its IT-enabled capabilities. However, the common denominator of these IT operations is the electricity consumption from renewable or non-renewable sources. Therefore, electricity should be considered as the most fundamental resource for a data center.
Metric to Measure Resource (Electricity) Utilization: PUE vs. RAI
Although the data center’s electricity should be primarily consumed by its ITE, a few exhaustive surveys indicate that on average 35-45 percent of data center electricity is consumed by its cooling hardware—such as server fans, computer room air conditioning (CRAC) units, building chillers, and cooling towers. The fraction of total electricity that is consumed by a data center’s ITE is given by its power usage effectiveness (PUE).
Despite being a useful and prevalent metric, PUE focuses only on the supply side of the value chain for an IDC. In fact, the state-of-the-art trend of designing the data center as a warehouse-scale computer calls for a holistic metric that can encompass the entire resource utilization value chain by a singular metric. In that direction, a metric, namely resource allocation index (RAI), is being proposed, as follows:
RAI = Normalized Resource Supply / Normalized Resource Demand
RAI measures how much electricity is required by a data center in order to serve one request. Taking the ratio of two end-points of the value chain (as shown in Figure 1), RAI is an end-to-end metric and useful for the holistic assessment of a data center’s resource allocation. The normalization is carried out with respect to peak demand and supply values.
RAI as a Quantitative Standard for Resource Provisioning
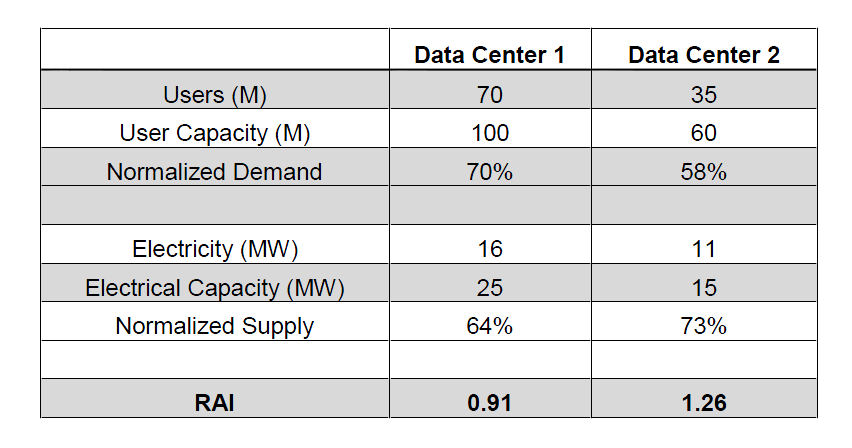
Table 1: Comparison of Resource Allocation Performances of Two Data Centers (Click to enlarge graphic.)
RAI can be used to compare the resource allocation performances of multiple data centers. Table 1 shows RAI values of two hypothetical data centers. While the RAI value for Data Center 1 is equal to 0.91, that value for Data Center 2 is 1.26. With a lower RAI value, Data Center 1 performs better in utilizing its resources.
A cursory glance to RAI definition suggests that a lower value of RAI is desirable because the data center is spending less resource in order to satisfy its demand. Nevertheless, a lower RAI value might not necessarily indicate better resource allocation performance. In fact, an RAI value that is too low suggests the given data center is not drawing the requisite electricity to support its demand. Such resource under-provisioning might cause a degraded service performance—e.g. slow response of amazon.com during Black Fridays—or even a downtime—e.g. the downtimes seen by users of healthcare.gov.
On the other hand, an RAI value that is too high means resource over-provisioning that would lead to significant waste of electricity. Therefore, a data center’s RAI value indicates whether its operating resources have been allocated in one of the following three modes: over-provisioned, under-provisioned, and optimally-provisioned. Depending on the tier-status and the operating constraints for a given data center, the upper limit (UL) and the lower limit (LL) for the RAI values can be defined. Within these RAI values, the data center can be considered to be optimally-provisioned. If we suppose UL=1.25 and LL=0.75, then Data Center-1 (RAI=0.91) is optimally-provisioned and Data Center-2 (RAI=1.26) is over-provisioned. Figure 2 illustrates the concept schematically.
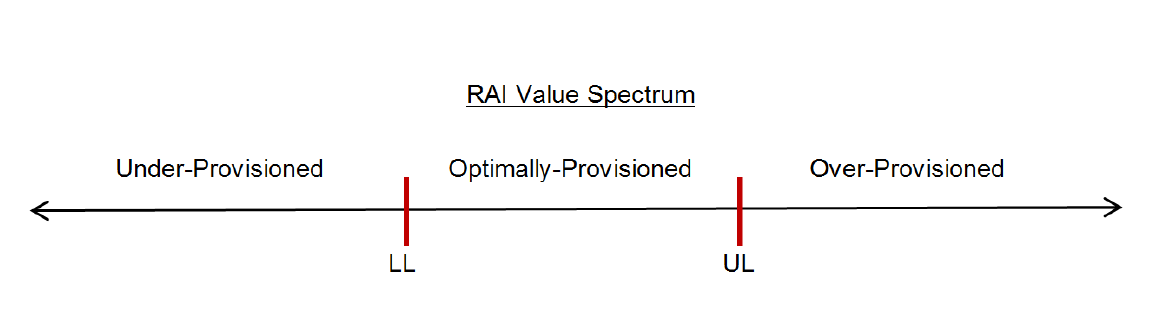
Figure 2: Assessment of Resource Allocation Performance based on RAI Values (Click to enlarge graphic.)
More on next page
RAI Measurement
A data center’s RAI changes with time, given that both demand and supply sides vary dynamically. While the resource demand varies randomly with the incoming user requests, the resource supply is controlled by the building management system (BMS) either through an intelligent scheduling algorithm or manual intervention.
The actual implementation of RAI requires measurements of resource demand and supply data. The demand/ network traffic data can be measured via the socket-level logs or other network-level archival systems. On the other hand, resource supply/ electricity consumption data can be derived from UPS/ PDU-level logs. Depending on the dynamic nature of resource demand and supply, a data center’s resource provisioning performance changes with time. This evolution can be captured by assessing the trend of RAI values.
RAI to Capture Dynamic Trend of Resource Allocation Mismatch
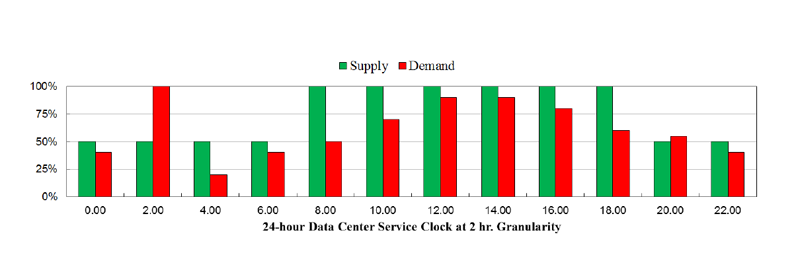
Figure 3: A Representative Resource Allocation Profile for a Data Center (Click to enlarge graphic.)
The following case-study illustrates how RAI can capture dynamic trend of a data center’s resource allocation. Figure 3 shows a hypothetical demand-supply profile for a representative IDC. Both demand and supply data are normalized with respect to their peak values. The sampling interval is 24 hours, with a temporal granularity of 2 hr.
While the green column represents resource supply, the red column indicates resource demand. The resource supply follows an empirical mechanism: between 8 AM-6 PM, the supply is set at 100 percent capacity, and between 8 PM-6 AM, it is set at 50 percent capacity. The demand, on the other hand, varies randomly.
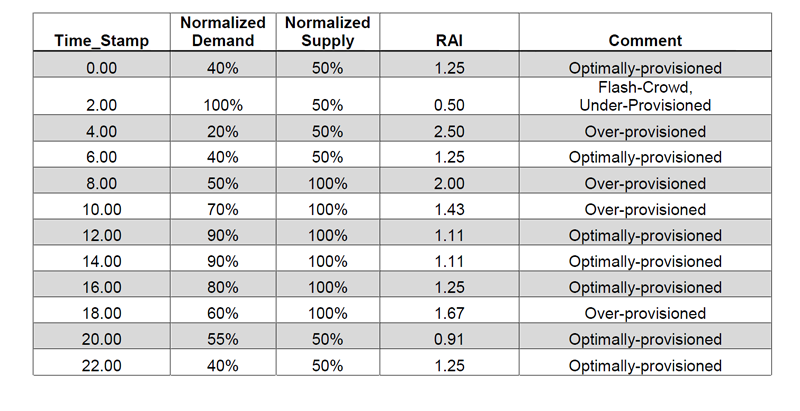
Table 2: Demand-Supply Profile for Resource Allocation and Corresponding RAI (Click to enlarge graphic.)
Table 2 shows demand and supply data, corresponding RAI values, and comments about the provisioning status based on UL=1.25 and LL=0.75.
A close scrutiny of the 2 AM demand profile suggests the occurrence of a flash-crowd like event, considering that the demand rises from 40 percent at 12 AM to 100 percent at 2 AM and then rapidly dips to 20 percent at 4 AM.
Recommendations
The author would like to highlight two potential ways RAI can be used by data center managers:
- As a tool to compare resource allocation performances of different data centers
- As a tool to assess how a data center’s resource provisioning status changes with time
The resulting tools can help a data center to become lean in following ways:
- Better balancing of demand and supply
- Reduce unnecessary waste
- Determine optimal resource allocation
Acknowledgement
The author would like to acknowledge the contributions of Mr. Mark Davidson, Cisco, and Dr. Yogendra Joshi, Georgia Tech, in preparation of this article.
Industry Perspectives is a content channel at Data Center Knowledge highlighting thought leadership in the data center arena. See our guidelines and submission processfor information on participating. View previously published Industry Perspectives in our Knowledge Library.


