Gary Bunyan is Global DCIM Solutions Specialist at iTRACS Corporation, a Data Center Infrastructure Management (DCIM) company. This is the 11th in a series of columns by Gary about “the user experience”. See Gary’s most recent columns: Keep Your Servers Cool – And Your Business Hot, Turning DCIM’s Big Data into Actionable Insight and Unlock Your Capacity By Unplugging Your Ghost Servers.
 GARY BUNYAN
iTRACS
If you’re like me, then the data center is the center of your professional universe. With tens of thousands of assets co-habitating in a vast web of inter-relationships and inter-dependencies, it’s one of the most complex entities on the planet and a simply amazing environment in which to work.
But for the millions and millions of technology users and consumers out there, they barely know that we, and our data centers, even exist. And that’s the way it should be.
Consumers can’t -- nor should they -- be bothered with the mind-boggling challenge of keeping all of those IT, facilities, and building management systems purring in harmony on the data center floor. All they want is the information those systems deliver in milliseconds so they can pursue their professional and personal lives with maximum freedom, choice, and success.
And I don’t blame them.
In fact, I’m very much like them.
Immediate and Valuable Information
I, too, want holistic information at my fingertips. But the information that I want, instantly and effortlessly, is a different kind of information. My colleagues and I want context-rich information about all of the assets, systems, applications, and workflows that feed into the operation of the data center so we can manage the physical infrastructure smarter.
I don’t want to be buried in massive amounts of unrelated and indecipherable spreadsheets. I don't want to be overwhelmed with tons of infrastructure-level minutia, literally trying to “connect the dots.”
Instead, I want holistic management information – instantly – at my fingertips. Information that is already “connected” and is contextually-rich, meaningful, and actionable so I can clearly see the disposition of the entire physical ecosystem and how to optimize it.
I want to be in what I call, the “Information Bubble.”
The Information Bubble
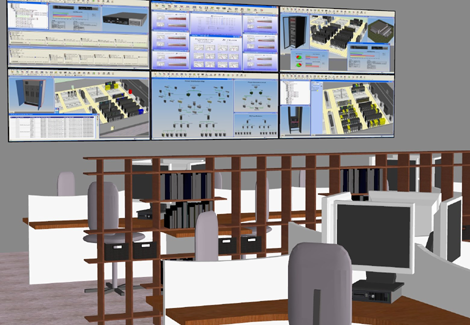
DCIM with interactive 3D visualization creates what I describe as an “information bubble” – a holistic, intuitive, real-time management environment, which, both literally and figuratively, immerses you in analytics, dashboards, and management tools giving you complete command-and-control over the physical ecosystem.
I call it a “bubble” because all of the information you need is right at your fingertips – and all of underlying data that got you there is beyond the bubble, outside of your periphery. So you’re neither distracted nor confused.
Inside the bubble:
- You are navigating within a living, breathing 3D model of your infrastructure so you can see, understand, and manage it with unparalleled clarity.
- You are immersed in deep-dive reports, dashboards, and analytics.
- Information comes to you intuitively and holistically – you don’t have to go get it
 The “information bubble” is like your own private operations center. Everything you need at your fingertips. Image courtesy of iTRACS software.
The Value of Interconnected Data
So how does DCIM take all of the underlying data about the infrastructure and present it contextually and holistically inside the “bubble?”
By collecting, aggregating and analyzing data about both individual assets and the interconnected environment in which they are operating.
Think of it this way:
The amount of data collected from today’s physical infrastructure is increasing exponentially. This includes data about power, space, network connectivity, cooling, server utilization, business output, work-per-watt, facilities loads, and much more. But this data isn’t information. And the proliferation of this data isn’t insight. It’s the interconnectedness and context of the data that creates the value.
Data becomes information when it is presented in context, with an awareness of the interconnected whole and a complete real-time view into the environment ¬– not just a portion of the environment over a “slice” of time.
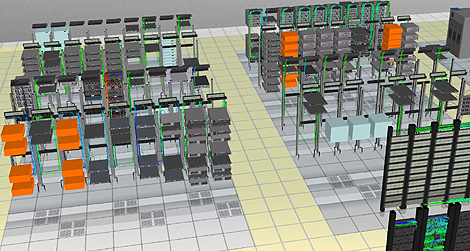
 Inside the “bubble,” the exact disposition of your assets, and what you need to do about it, is crystal clear. Image courtesy of iTRACS software.
Remember: Give someone a piece of data and you haven’t changed anything. Teach them how to turn it into information and you’ll change the world.
Industry Perspectives is a content channel at Data Center Knowledge highlighting thought leadership in the data center arena. See our guidelines and submission process for information on participating. View previously published Industry Perspectives in our Knowledge Library.


