
Winston Saunders has worked at Intel for nearly two decades and currently leads server and data center efficiency initiatives. Winston is a graduate of UC Berkeley and the University of Washington. You can find him online at “Winston on Energy” on Twitter.
 WINSTON SAUNDERS
Intel
This blog post builds on the previously published Exascalar Results from November 2012 which gives insights into the Exascalar analysis of the November 2012 Green500 list. In Part II, I’ll look into some trends that highlight the “necessary but not sufficient” dependency of supercomputing leadership on efficiency.
Trends Over Time
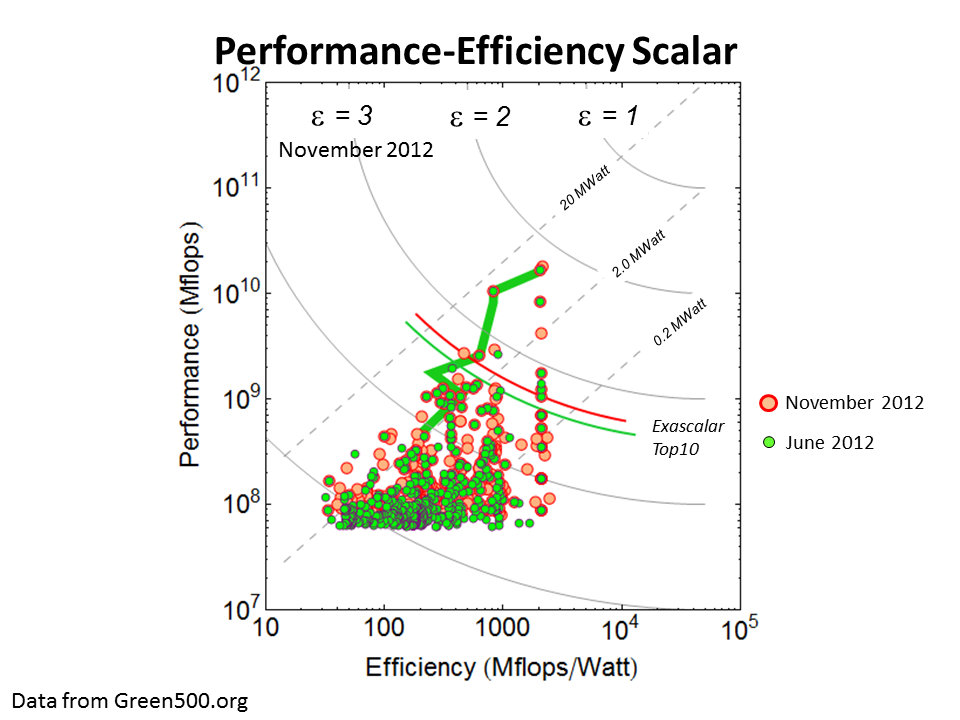
The first trend is the time development of Exascalar. Overlaying the current Exascalar plot with the one from June 2012 emphasizes changes, as shown in the figure below.
Click to enlarge graphic.
The most remarkable new systems are in the low-performance, high-efficiency regime. In this case, the leading efficiency system is the Beacon-National Institute for Computational Sciences/University of Tennessee based on the Xeon Phi architecture. Recall that the June 2011 Exascalar analysis showed a similar efficiency revolution being launched with the BlueGene Architecture. So watch this space.
Looking solely at the ordinal Green500 and Top500 rankings on the Exascalar list conceals the vital role efficiency leadership plays in Exascalar. The number one Exascalar computer is first in performance and third in efficiency. But number two Exascalar is second in performance and 29th in efficiency.
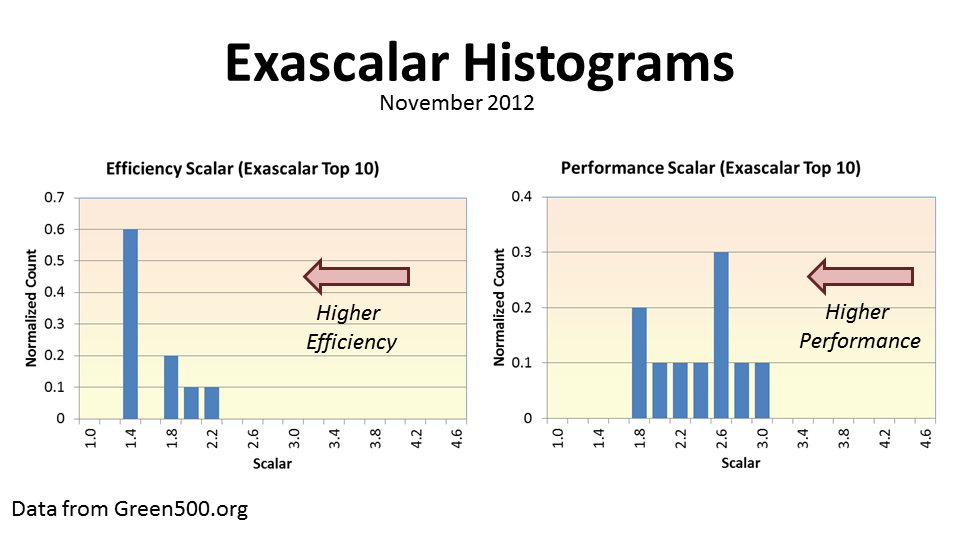
One way to look at this is a histogram of the efficiency and performance scalars of the Exascalar systems as shown below. Recall that the performance and efficiency scalars are just the negative logarithm of performance and efficiency normalized to the equivalent of 1018 flops in 20 MegaWatts. Each graph shows two curves, one for just the Top10 Exascalar systems, and for the entire population. Both curves are normalized to the size of the populations for display purposes.
Click to enlarge graphic.
The “big” observation is that the range of system efficiency for the Top 10 systems is strongly biased toward the upper end of the distribution. The performance distribution for the top 10 spans a greater range and is “flatter.” Looking at the whole top500 Population there appears a deeper systematic difference between the distribution of performance and efficiency data. (If there’s interest - just request it in the comments section below - I can blog about it.)
The last trend of interest is the historical trend of Exascalar. The top score didn’t change much but the overall trend remains consistent. The Top Exascalar “best fit” trend is consistent with factor of ten in efficiency or performance every 2.7 years. This is equivalent to a doubling time t2 = 0.8 years!
The median trend diverges from the other two trend lines in the figure. There are several possible explanations why this is the case, but it’s likely related to the rapid pace of innovation at the top end (80% of the Top 10 Exascalar systems are new since 2011) systems or the rate of replacement for systems already in operation.

Click to enlarge graphic.
This latter point might be worth some scrutiny. At the base of the “Exascalar triangle” the systems with 108 Mflops performance range in power consumption from roughly 2.0 MWatt to about 20 kWatt. That’s roughly a $2.0 Million difference in annual electricity expenses for the same performance.
As always, your thoughts and comments are appreciated.
Industry Perspectives is a content channel at Data Center Knowledge highlighting thought leadership in the data center arena. See our guidelines and submission process for information on participating. View previously published Industry Perspectives in our Knowledge Library.


